Introduction
The dashboard has three sets of charts that help business managers assess sales performance. This article shows you how to read and customise those charts.
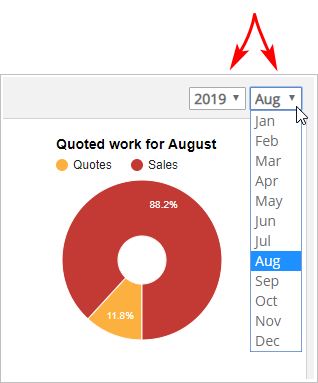
1 Adjusting the time frame
The three charts compare two sets of data:
- current month
- selected month
You can customise the charts by changing the selected year and month.
- Scroll to the right side of the page and locate two boxes.
- Click the first box to change the year.
- Click the second box to change the month.
2 Reading the bar graph
The bar graph is on the left side of the page. This graph summarises quotes, sales, and payments.
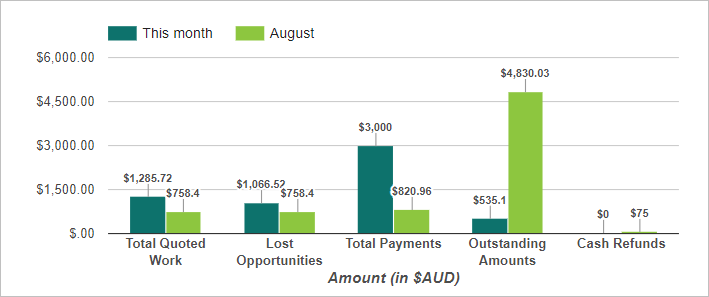
- Total Quoted Work: total value of quotes outstanding or quotes converted into a sale but have not generated a payment.
- Lost Opportunities: value of quotes not converted to a sale.
- Total Payments: cash in the door.
- Outstanding Amount: total balance due.
- Cash Refunds: cash payouts to customers.
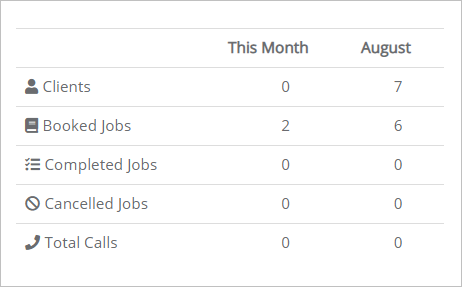
3 Reading the table
This table is in the middle of the page. These data help business managers calculate customer conversion rates by comparing the number of calls to booked jobs.
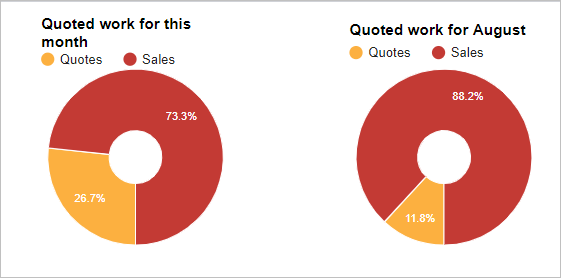
4 Reading the pie charts
Two pie charts are on the right side of the page. These charts show the percentage of quotes that did not generate a sale.