Introduction
You’ll find marketing performance data at the bottom of the dashboard. This article shows you how to customise the time frame.
1 Adjusting the time frame
- On the dashboard, scroll down to the Marketing Performance heading.
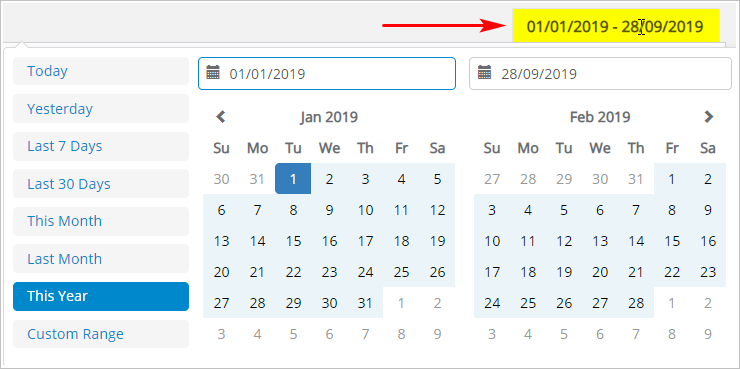
- Scroll to the right side of the section and locate the box with dates.
- Click the box. A calendar displays.
- Select a time period. The calendar closes and the time frame changes.
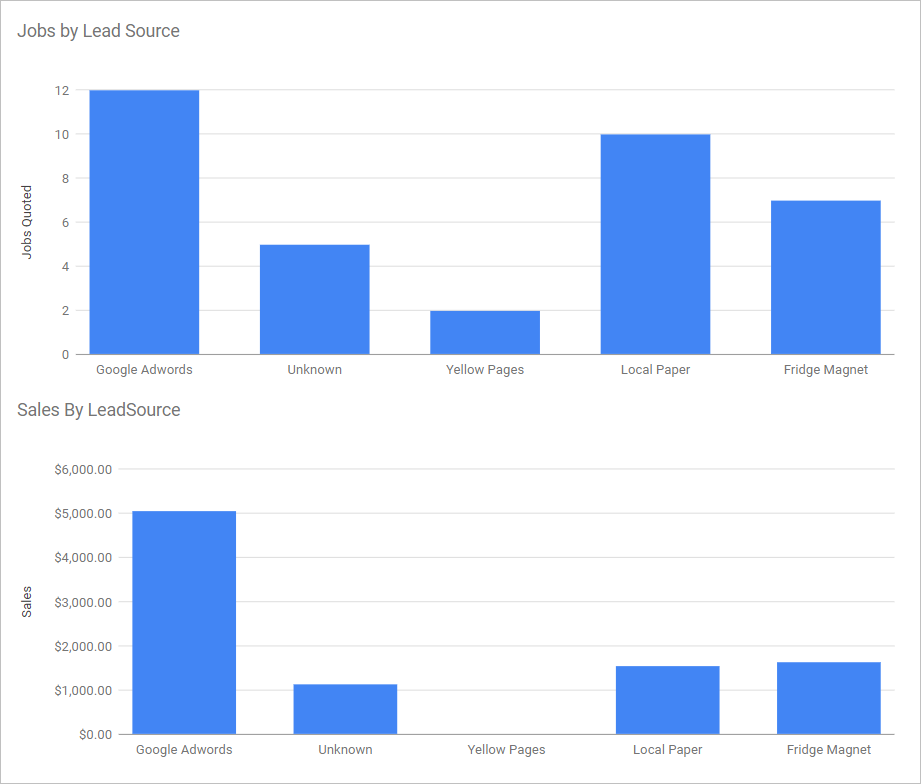
2 Reading the charts
There are two charts.
- The first chart shows the number of jobs earned by type of lead source for the time frame.
- The second chart shows sales (measured in dollars) by type of lead source for the time frame.