Introduction
The centre of the dashboard presents sales performance statistics over a set time period. This article shows you how to locate the data and customise the time frame.
1 Adjusting the time frame
- On the dashboard, scroll down the Sales Statistics heading.
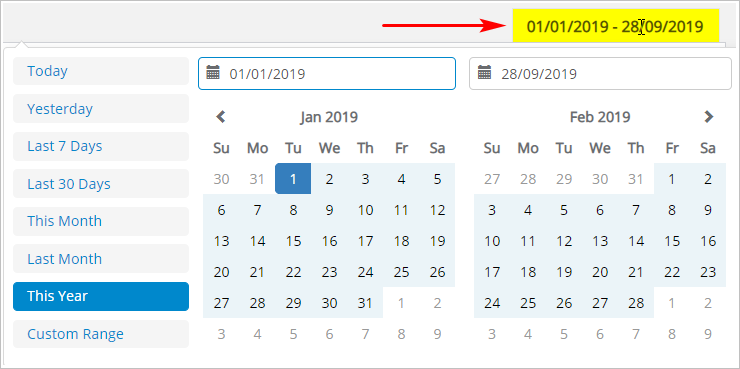
- Scroll to the right side of the statistics section and locate the box with dates.
- Click the box. A calendar displays.
- Select a time period. The calendar closes and the time frame changes.
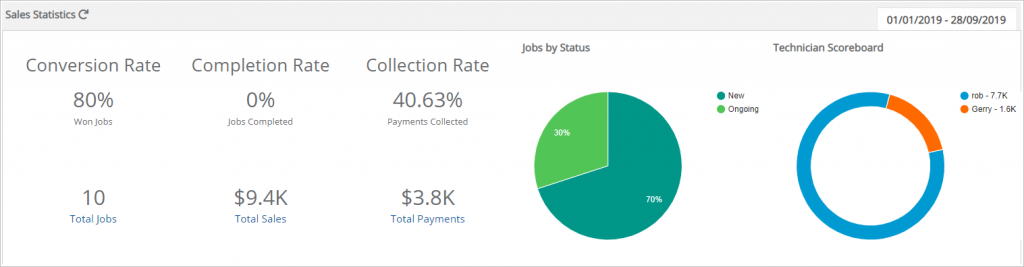
2 Reading the statistics
The stats section presents 8 types of facts. The image below shows stats for the year to date.