Introduction
Client reports provide managers with important business information. By the end of this article, you’ll learn how to:
- create a Client report
- sort data by category
- view chart data
- download job data
1 Opening the reports page
- Scroll up to the top of the page.
- On the main menu bar, click Reports. The Reports page displays.

2 Selecting the sort category
The first step is to select a sort category. This decides how the data will be grouped in the charts.
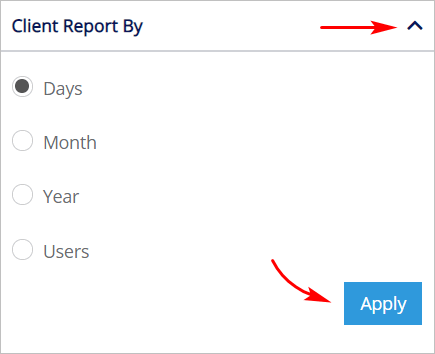
- Scroll up to the top of the page and locate the box called Client Report By.
- Click the arrow to expand the box.
- Select one option and then click Apply. The data in the chart updates.
The first three options in the box (i.e. days, month, year) sort data by different time periods. The last option, User, refers to the people who input data into the system.

3 Reviewing report data
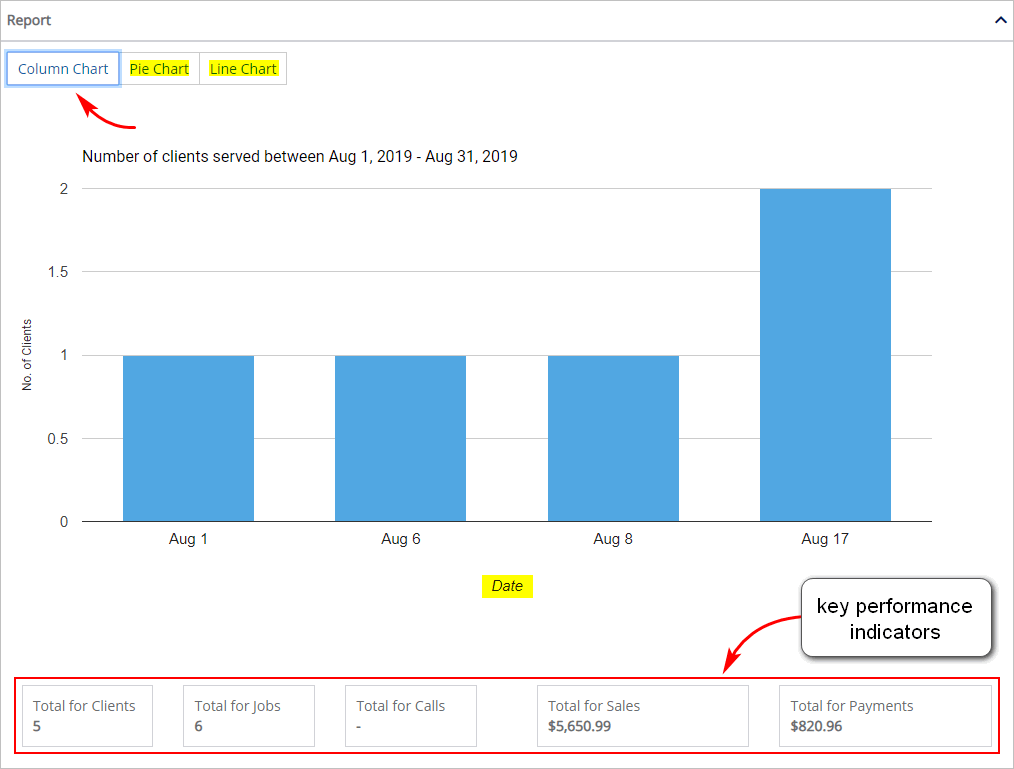
After selecting a sort category, the next step is to review report data. There are two types of data in the Report box:
- number of clients sorted by category
- key business indicators (clients, jobs, calls, sales, and payments)
- Locate the Report box. Column is the default chart display.
- To change the chart display, click Pie Chart or Line Chart.
The column chart below shows the number of clients served per day.

4 Reviewing data output
Below the chart, a table presents the same data in a different format. The image below shows a table with the number of clients for several days.

5 Filtering the data
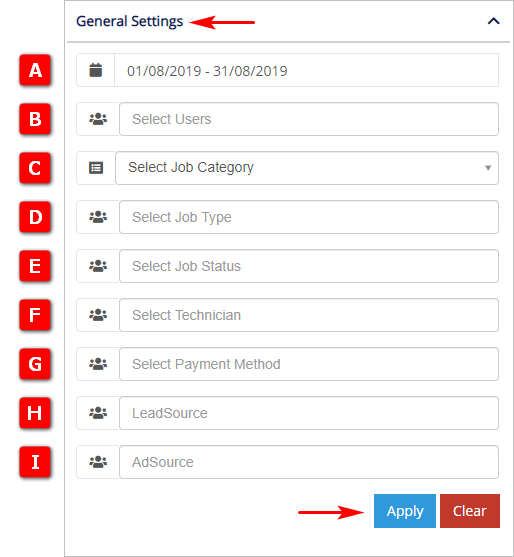
You can zoom in on specific parts of the data by using one or more search filters. These filters are in the General Settings box.
- Scroll down to the bottom of the page and locate the General Settings box.
- Click the arrow to expand the box.
- Select one or more options in the box and then click Apply. The chart updates.
- Click Clear to remove the search filter settings.

A Date
Change the time period of the data set. Click the box and then select a time period on the calendar.
B Select Users
Sort data based on the person who manages your system (called a user). The number of users depends on your business operation. Click the box and then select a user name on the menu. You can include more than one user in the search field.
C Select Job Category
Click the box and select an industry (i.e. plumbing, electrical, or HVAC) on the menu.
D Select Job Type
Sort data based on job type. The types of jobs in the drop-down menu depend on your Job Category choice. If you leave Job Category blank, the Job Type menu does not work. You can include more than one job type in the search field.
E Select Job Status
Sort data based on job status (e.g. new, completed, no answer, etc.). You can include more than one job status in the search field.
F Select Technician
Narrow the data output by focussing on technicians. The number of names on the drop-down menu depends on your staffing. Click a name to add it to the filter. You can include more than one technician in the search field.
G Select Payment Method
Narrow the data output by focussing on payment methods. Click the box and then select a payment method from the drop-down menu. You can include more than one method in the search field.
H Lead Source
Click the box and select a source from the drop-down menu. The default list has five options: Google Adwords, Unknown, Yellow Pages, Local Paper, and Fridge Magnet. You can include more than one source in the search field.
I Ad Source
Click the box and select a source from the drop-down menu. This field contains data only if you’ve integrated with a third party call tracking service.
6 Saving the datasheet
Scroll down to the bottom of the page and locate the Datasheet box. Here, you can find client information for the data points in the charts. The information in the datasheet includes:
- date
- job ID
- client phone number
There are four ways to save this data:
- download a CSV file
- download a PDF
- print a PDF
- export an Excel file
