Introduction
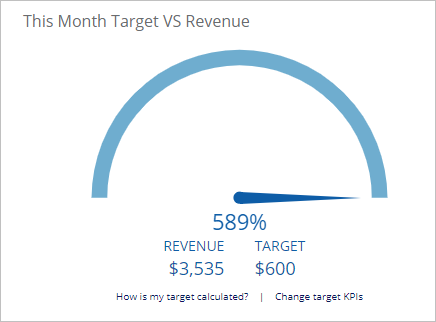
The dashboard includes a graph that compares revenue with a pre-determined target. These figures are not meant to provide a detailed accounting of your business for the past month. Instead, the chart summarises data for key performance indicators (KPI).
The target is a calculation based on an assumed dollar value per job type. To see and modify the values attached to the KPIs, see:
1 Understanding the chart
The dashboard chart gives you a snapshot of business performance.
- Revenue is business income in the current calendar month.
- Target is a figure automatically generated by the system.
